
[Ed: Kevin Murphy said that our articles inspired him to write this. We said that we want to repost it. We are, with his permission, and hope he will become a regular contributor. First published 4/24/19, updated 5/21/19 on GunGoal.com.]
Suppose one is considering whether he/she should get a gun for home defense, disregarding all other factors such as 2A supporter and fun of shooting sports, one crucial determinant is how fast and reliable the cops could come to his/her emergency call.
Many scientific studies (and common sense) tell us that the shorter the police response time, the higher arrest rate1, safety2 and satisfaction.
In this article, I’ll be digging into data of police response time, factors that lengthen/shorten police response time, average time criminal took to complete a crime and lastly, is buying a gun for self and home defense a good idea.
Table of Contents
Time for Police to Respond to an Emergency Call
A Nationwide Study
Source : Police Response Times to Calls for Service: Fragmentation, Community Characteristics, and Efficiency – Daniel S. Bennett (Nov 2018)3

A dispatcher takes an emergency call at the Jackson, Tennessee 9-1-1 Dispatch Center. (2003)
Daniel S. Bennett, the researcher made a series of Freedom of Information Act (FOIA) requests to 249 different police and law enforcement agencies across the nation for every record of Computer Aided Dispatch (CAD) systems during January 2015 to December 2016.
Though almost every agency responded to his initial request, only 57 agencies provided him with data citing technical limitations. Typical technical limitation is that their CAD systems were not designed to allow users to extract customized reports, and the default reports contained personal information, such as names, that would have to be redacted by hand and thus prohibitively expensive to assemble.
17 out of these 57 datasets were incomplete and were dropped from the study. Final sample of 40 datasets consists of 7.5 million CAD (Computer Aided Dispatch) events, of which, 3.4 million were public calls for service.
Before we continue, let’s take a look at some definitions.
- Police Response Time = The time between the call being created by CAD (Computer Aided Dispatch) system and the first officer arriving on scene
- High Priority – The researcher
classified incidents into Priority 1, 2 and 3.
- Priority 1 = Calls that require an immediate response, which includes crimes in progress and some medical emergencies
- Priority 2 = Calls requiring an expedited response, which includes crimes that occurred recently, some traffic accidents, etc…
- Priority 3 = Calls that require a routine response, which includes crimes without a suspect, noise complaints, reports and patrols, etc..
Generally, police respond to Priority 1 calls faster due to urgent nature of the calls. For our purpose, we’ll be focusing on the police response time of Priority 1 calls of this paper.
From those 40 datasets, there are :
| Calls | Percentage | |
| Priority 1 | 667,172 | 19.44% |
| Priority 2 | 1,608,127 | 46.86% |
| Priority 3 | 1,156,145 | 33.69% |
| Total | 3,431,444 | 100.00% |
Research findings
Police response time in minutes for each priority calls :
| Priority 1 | Priority 2 | Priority 3 | |
| Mean | 24.8 | 37.8 | 94.3 |
| Median | 8.8 | 12.3 | 22.7 |
| SD | 81.5 | 93.2 | 175.9 |
According to this data, 50% of the time (Median), police can respond within 8.8 minutes for priority 1 calls. Average and standard deviation are much higher than median, suggesting much slower response time for other unfortunate cases.
Cumulative Distribution Function of Raw Response Times in Minutes by Priority

For Priority 1 calls :
| Responded within | Probability | Cumulative Probability |
| 5 minutes | 20% | 20% |
| 5 – 8.8 minutes | 30% | 50% |
| 8.8 – 12 minutes | 10% | 60% |
| 12 – 18 minutes | 20% | 80% |
| 18 – 60 minutes | 15% | 95% |
| More than 60 minutes | 5% | 100% |
The above is a national data.
Let’s take a closer look at police response time rate of each city.
Police Response Time by City
20 cities’ average police response time, land areas, population estimates and population density.
| Rank | City | Data period | Average police response time (mm:ss) | 2016 land area (sq mi) | 2017 population estimate | 2016 population density (per sq mi) |
| 1 | Jacksonville, FL | 2017 | 3:134 | 747.4 | 892,062 | 1,178 |
| 2 | Chicago, IL | Jan 1, 2012 – Feb 12, 2012 | 3:285 | 227.3 | 2,716,450 | 11,900 |
| 3 | Allen, TX | 2015 | 4:176 | 27.1 | 100,685 | 3,715 |
| 4 | San Francisco, CA | July 2017 – June 2018 | 5:307 | 46.9 | 884,363 | 18,569 |
| 5 | Houston, TX | Jan 2019 – Feb 2019 | 5:358 | 637.5 | 2,312,717 | 3,613 |
| 6 | Los Angeles, CA | Dec 2017 | 6:069 | 468.7 | 3,999,759 | 8,484 |
| 7 | New York City, NY | Jan 7, 2019 – March 25, 2019 | 6:1810 | 301.5 | 8,622,698 | 28,317 |
| 8 | Seattle, WA | 2018 | 6:2011 | 83.8 | 724,745 | 8,405 |
| 9 | Phoenix, AZ | Feb 1, 2017 – May 31, 2017 | 6:2712 | 517.6 | 1,626,078 | 3,120 |
| 10 | Washington, D.C. | 2017 | 6:4113 | 61.1 | 693,972 | 11,148 |
| 11 | San Antonio, TX | 2017 | 6:4814 | 461 | 1,511,946 | 3,238 |
| 12 | Austin, TX | 2018 | 7:0915 | 312.7 | 950,715 | 3,031 |
| 13 | Indianapolis, IN | 2011 | 7:1216 | 361.5 | 863,002 | 2,366 |
| 14 | Boston, MA | 2011 | 7:4017 | 48.3 | 685,094 | 13,938 |
| 15 | Dallas, TX | Jan 1, 2019 – Feb 12, 2019 | 8:0618 | 340.9 | 1,341,075 | 3,866 |
| 16 | San Jose, CA | July 1, 2017 – June 30, 2018 | 9:1219 | 177.5 | 1,035,317 | 5,777 |
| 17 | Detroit, MI | 2018 | 14:1820 | 138.8 | 673,104 | 4,847 |
| 18 | Denver, CO | 2013 | 14:1821 | 153.3 | 704,621 | 4,521 |
| 19 | San Diego, CA | 2018 | 16:3022 | 325.2 | 1,419,516 | 4,325 |
| 20 | Milwaukee, WI | 2015 | 21:0023 | 96.2 | 595,351 | 6,186 |
*Population and land area data is from : https://en.wikipedia.org/wiki/List_of_United_States_cities_by_population24
Correlation tests on these 20 data points reveal that police response time has :
- -0.3 correlation with land areas
- -0.21 correlation with population
- -0.18 correlation with population density
Apparently, larger land area contributes to longer police response time. Next we explore some other known factors affecting police response time.
Factors Affecting Police Response Time

Police response time is faster during the night.
Perhaps the most obvious factors that come to mind are distance and traffic. Farther distance and traffic congestion would obviously delay police response time.
But guess what? There are tons of other not-so-obvious factors lying around such as race income, neighbourhood, crime frequency and more. Here are a list of factors with supporting papers:
- Time of incidents
Police response time is shorter during night time than day time. (2001)25
Calls for domestic violence made on weekends had significantly less response time. (2017)26
Rush hour (0700-0900 and 1600-1800 on weekdays) did not appear to be associated with domestic violence call response time. (2017)26
2. Distance from response station
Crimes further away from response station have higher average response time and lower clearance rate. Luckily, the study showed that farther distance from response station correlates with lower crime rate. (2015)27
3. Traffic
Traffic slows down fire trucks arriving at the scene of an emergency and increases the average monetary damages from fires. (2018)28
4. Weapon
Presence of weapon was associated with a lower response time for domestic violence calls. (2017)26 (2008)29
5. Neighborhood Characteristics

Hispanic neighborhoods enjoy faster police response time.
Police response time is shorter in neighborhoods with low income and a high level of minority population. (1978)30
For domestic violence cases in Houston, Hispanic complaints experienced significantly faster police response time. (2017)26
A study in 1997 suggested the opposite, that police response time was longer in socially and economically stressed neighborhoods. (1997)31
6. Crime Hotspots
Police agencies deploy more patrol units during certain times and days and in areas which generate high demands, contributing to more efficient, quicker responses and fairer officers’ workloads. (1992)32
A study in 1997 suggested the opposite, that police response time increased after responding to repeated Calls For Service from a high crime neighborhood. (1997)31
Quite a number of factors contribute to police response time. But to determine whether the waiting time is long or short, we need to know how much time criminals need to conduct their evil deeds.
Average Crime Duration:
- Burglary
According to a 2013 research by SECURAMERICA33 :

Average burglary duration is 8 – 12 minutes.
- Average burglary duration is 8 – 12 minutes.
- Most burglaries occur during 10 a.m. – 3 p.m. since that’s a prime time frame where many homes are not occupied.
- Average dollar lost from a burglary in the US is just over $2,000.
- Cash, jewelry, guns, drugs and small electronics (smartphones, tablets) are the most common items stolen due to ease of carrying and ease of turning them into money.
- Burglaries typically spike during the summer months (July and August).
- Regionally, the south accounts for 47% of burglaries (the relatively warmer weather is a key contributor of this). The Midwest and West each account for 21% of burglaries, and the Northeast accounts for the remaining 11%.
- The State of Ohio experiences the most burglaries in the country.
- Only 13% of burglaries are arrested on average, resulting in low chance of recovering your stolen possessions.
- Burglars want an easy target where they won’t likely be seen and can get in & out fast.
- Although burglars are typically not prone to violence, when surprised or confronted by an occupant, they could attack.
Another research in 2012 by University of North Carolina at Charlotte, Department of Criminal Justice & Criminology34, employing survey data on 422 incarcerated burglars from North Carolina, Kentucky and Ohio, found that :
- Most burglaries are finished within less than 10 minutes (although some lasted over an hour).
- Top cited reason
s for engaging
in burglary are :
- Drugs
- Money
- Foolishness
- Thrills
- Revenge
- Female burglars prefer home and residence targets in the afternoon time frame, while male burglars focus on business targets in the late evenings.
If the majority of burglaries were done within 12 minutes, and 60% of Priority 1 police response time are within 12 minutes, we can conclude that even if victims dial 911 immediately at the beginning of burglaries, the police didn’t arrive at the crime scene before burglars fled for at least 40% of the cases.
Obviously, there are cases where victims were not at home, or did not notice the invasion immediately. Thus, cases where police could come to prevent and protect victims from burglaries are even less than 60%. Luckily, most burglars aim for monetary gains and hurting victims aren’t their primary goal.
FBI data indicates that there were 1,430,698 burglary cases in 2017
2. Sexual Assault
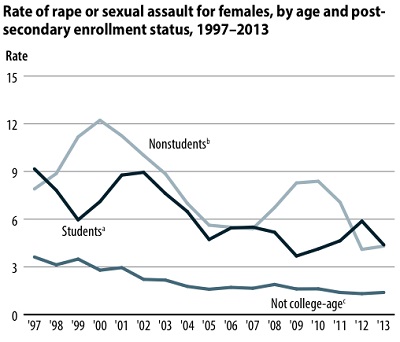
According to Siskiyou Domestic Violence & Crisis Center35, average sexual assault lasts 4.5 hours. Some sexual assault cases span over a period of days.
Data from RAINN.org36suggests that :
- On average, there are 321,500 victims (age 12 or older) of rape and sexual assault each year in the United States.
- People age 18-34 have the highest risk of sexual violence.
- 1 out of every 6 American women has been the victim of an attempted or completed rape in her lifetime.
- 90% of rape victims are female.
- Transgender students are at higher risk for sexual violence
- Sexual violence can have long-term effects on victims
- American Indians are twice as likely to experience a rape/sexual assault compared to all other races.
Since average duration for rape is 4.5 hours, police response time is fairly good for this type of crime.
3. Murder, Nonnegligent Manslaughter and Aggravated Assault

There are 16,617 cases of Murder and non-negligent manslaughter in US 2017. u
Criminals armed with guns, knives or other weapons can seriously injure victims within seconds.
According to “Murder and Medicine : The Lethality of Criminal Assault 1960-1999”37, a 2002 study :
- Injured victims from aggravated assault and homicide cases in St. Louis has 4% mortality rate if they arrived at a hospital within 20 minutes of their injury.
- If victims arrived later than 20 minutes, mortality rate jumped to 20%.
Data from “Office for Victim of Crimes”38 regarding Homicide shows that :
- In 2016, there are 5.3 murders and non-negligent homicides for every 100,000 people.
- Main homicide victims are male and female age between 20-29 and female age above 50.
- Black male and white female are more riskier to be homicide victims.
- The majority of perpetrators are Non-family acquaintances.
For assault cases, data from “Office for Victim of Crimes”39 indicates that :
- There are 11.8 and 3 cases of aggravated assault and simple assault per every 1,000 people
- In 2015, 33% of aggravated assault victimizations were committed with a knife, 23% with a firearm, and 11% without a weapon.
- More than half of aggravated assaults were committed by acquaintances of the victims.
- “At or near victim’s home” is the aggravated assault hotspot for female victims. While commercial place, parking lot and public areas are hotspots for male victims.
- People age above 35-49 have the highest risk for aggravated assaults.
Since these types of crimes are done within matter of seconds while the police are minutes away, you certainly need some form of self-defense mechanism.
Conclusion
During January 2015 to December 2016, national average police response time is within 8 minutes 48 seconds. Police response time differs greatly between cities due to factors such as traffic, distance, neighborhood and weapons involved. Thus it would be wise for you to check average police response time in your area.
Comparing average police response time with average crime duration, police won’t be able to arrive in time to catch burglars at crime scene for at least 40% of the cases. For sexual assaults, police response time should be adequate.
However murder, manslaughter and aggravated assaults are types of crime where police response time falls short, and you’d need to depend on your own defense mechanism.
“As the old saying goes, when seconds count, the police are just minutes away.”
Sources
- Relationship of Response Delays and Arrest Rates – C Clawson; S K Chang (1977)
- Response Time and Citizen Evaluation of Police – S L Percy (1980)
- Police Response Times to Calls for Service: Fragmentation, Community Characteristics, and Efficiency – Daniel S. Bennett (Nov 2018)
- https://www.jdnews.com/news/20180715/calls-up-response-times-down-for-local-law-enforcement
- https://www.wbez.org/shows/wbez-news/chicago-police-response-time-is-down-in-2012/6f6f56c9-ff77-40ca-ab47-737f0c31e81f
- https://www.cityofallen.org/CivicAlerts.aspx?AID=1323&ARC=2406
- https://sfcontroller.org/sites/default/files/Documents/Auditing/FY18%20Annual%20Performance%20Report%20FINAL.pdf#page=11
- https://www.houstontx.gov/police/department_reports/operational_summary/FEBRUARY19.NIBRS_Monthly_Operational_Summary_FINAL%20032019.pdf
- https://www.nbclosangeles.com/news/local/LAPD-Pulling-Out-of-LAX-Narcotics-Task-Force-as-it-Works-to-Boost-Patrols-503166701.html
- https://www1.nyc.gov/site/911reporting/reports/end-to-end-detail.page
- https://www.seattle.gov/police/information-and-data/calls-for-service-dashboard
- https://www.abc15.com/news/region-phoenix-metro/central-phoenix/phoenix-police-taking-longer-to-respond-to-911-calls-despite-adding-officers
- https://mpdc.dc.gov/sites/default/files/dc/sites/mpdc/publication/attachments/MPD%20Annual%20Report%202017_lowres.pdf
- https://report.sa2020.org/community-safety/
- http://www.austintexas.gov/budget/eperf/index.cfm?fuseaction=home.PerfMeasure&DEPT_CD=POLIC&DIV_CD=5OPS&GP_CD=21AA&MEASURE_ID=6689
- http://ftpcontent.worldnow.com/wthr/PDF/impdreport.pdf
- https://www.cityofboston.gov/images_documents/Police%20-%20FY11%20Q1%20Web_ver2_tcm3-21707.pdf
- https://www.dallaspolice.net/resources/CrimeReports/New%20Response%20Time%20Report.pdf
- http://www.sanjoseca.gov/DocumentCenter/View/81795
- https://www.detroitnews.com/story/news/local/detroit-city/2019/02/04/detroit-police-response-times-questioned/2744186002/
- https://www.denvergov.org/content/dam/denvergov/Portals/741/documents/Audits_2016/FollowUpReports_2016/Police-Response-Time_FollowUpReport_August2016.pdf
- https://www.sandiego.gov/sites/default/files/fy18pb_v2police.pdf
- https://milwaukeenns.org/2018/08/06/special-report-mpd-slow-to-respond-to-violent-crime-calls-police-data-shows/
- https://en.wikipedia.org/wiki/List_of_United_States_cities_by_population
- L. Blake, R. T. Coupe, The Impact of Single and Two-Officer Patrols on Catching Burglars in the Act: A Critique of the Audit Commission’s Reports on Youth Justice, The British Journal of Criminology, Volume 41, Issue 2, March 2001, Pages 381–396, https://doi.org/10.1093/bjc/41.2.381
- Lee, J.-S., Lee, J., & Hoover, L. T. (2017). What Conditions Affect Police Response Time? Examining Situational and Neighborhood Factors. Police Quarterly, 20(1), 61–80. https://doi.org/10.1177/1098611116657327
- Blanes, Jordi & Kirchmaier, Tom. (2015). The Effect of Police Response Time on Crime Detection. SSRN Electronic Journal. 10.2139/ssrn.2630987.
- Beland, Louis-Philippe & Brent, Daniel. (2018). Traffic congestion, transportation policies, and the performance of first responders.10.13140/RG.2.2.10201.42088.
- Kernsmith, Poco & Craun, Sarah. (2008). Predictors of Weapon Use in Domestic Violence Incidents Reported to Law Enforcement. Journal of Family Violence. 23. 589-596. 10.1007/s10896-008-9181-8.
- Mladenka, K. R., Hill, K. Q. (1978) The distribution of urban police services. The Journal of Politics 40(1): 112–133.
- Klinger, David. (1997). Negotiating order in patrol work: An ecological theory of police response to deviance. Criminology. 35. 277 – 306. 10.1111/j.1745-9125.1997.tb00877.x.
- Walker, S. (1992) The police in America, New York, NY: Mcgraw-Hill.
- http://www.jsu.edu/police/docs/Schoolsafety.pdf
- http://airef.org/wp-content/uploads/2018/10/BurglarSurveyStudyFinalReport.pdf
- https://sdvcc.org/sexual-assault
- https://www.rainn.org/statistics/victims-sexual-violence
- http://www.universitychurchchicago.org/wp-content/uploads/2013/06/Murder-and-Medicine.pdf
- https://ovc.ncjrs.gov/ncvrw2018/info_flyers/fact_sheets/2018NCVRW_Homicide_508_QC.pdf
- https://www.ncjrs.gov/ovc_archives/ncvrw/2017/images/en_artwork/Fact_Sheets/2017NCVRW_Assault_508.pdf
.
.

— DRGO Editor Robert B. Young, MD is a psychiatrist practicing in Pittsford, NY, an associate clinical professor at the University of Rochester School of Medicine, and a Distinguished Life Fellow of the American Psychiatric Association.